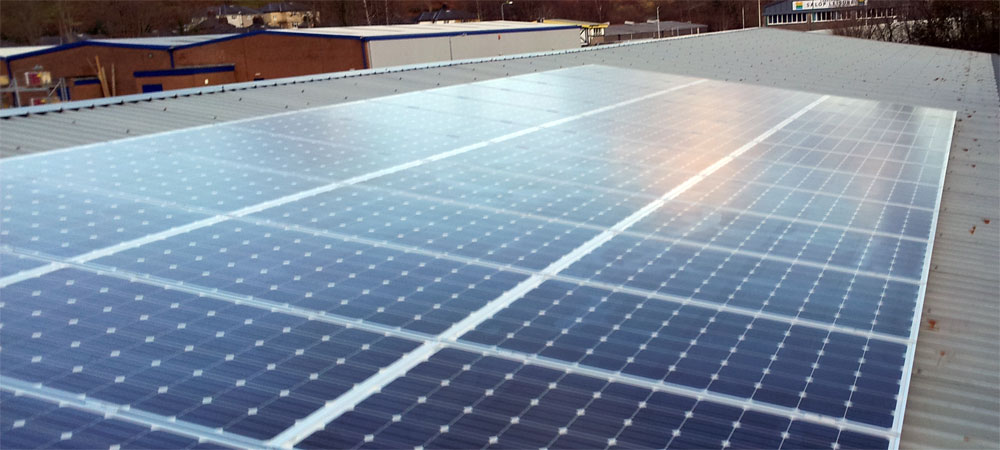
Solar Panels in Oxford
Here at Exeo Energy we are experts at designing and installing high quality solar panel sytems for domestic and commercial customers. We are based in central Oxford and service Oxfordshire and the surrounding areas.
Our technical staff have designed solar panel systems that have been installed all over the world and our installation staff have installed 100’s of solar panel systems over a number of years.
But how good a place is Oxford to install solar panels? Here we will take a look at how Oxford compares with the rest of the country for generating solar electricity. We will also take some time to consider the main factors that influence the production of solar panel sytems regardless of geographic location.
Exeo Energy are monitoring a large number solar panel systems, both domestic and commercial, across the UK. This gives us a great insight into energy production in different areas.
Solar Panels in Oxford compared to the rest of the UK
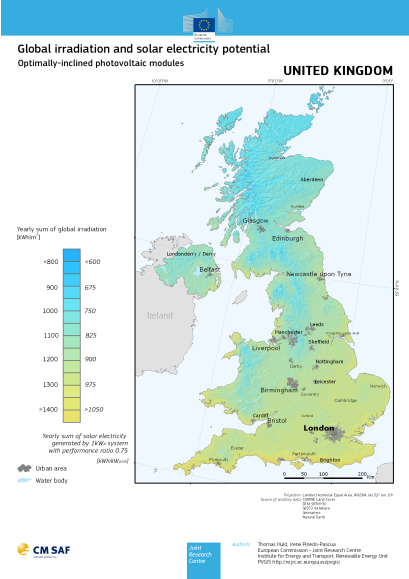
First let’s look at a UK map of ‘global irradiation’ (basically the amount of solar energy that falls on an area in kWh/m2) and energy generated by optimally-inclined solar panels (kWh/kWp). Unfortunately the map we have uses pretty unexciting colours – it would be better if it used some nice warm oranges and reds instead of blues and greens! However we can see that there is a significant difference between the south coast of England and the north of Scotland. Interestingly it is not a uniform gradient from south to north but there are patches that tend to do better or worse than neighbouring areas caused by local micro-climates and geography. For example you can see that the coastal areas tend to have a higher solar irradiation than mountainous areas at a similar latitude.
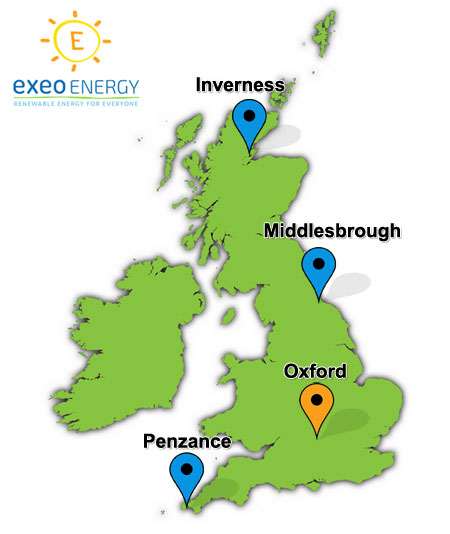
We have chosen four potential solar panel sites spread out reasonably equally from the north to south of the UK - this will help to demonstrate the difference as clearly as possible. From north to south we have chosen Inverness, Middlesbrough, Oxford (of course) and Penzance.
In order to keep all things equal we have used data from the EU’s Photovoltaic Geographical Information Service (PV-GIS) and kept all variables the same. The variables we will keep the same are:
-
Solar panel array size – We will use 1 kWp in all cases
-
Orientation from south – We will assume the system is facing directly south
-
Pitch of the solar panel array – We will model the system at 35 degrees, most domestic UK roofs are close to this.
-
Shading – We will assume that there are no significant shading issues.
-
Estimated system losses – we will assume 14% in all cases
Oxford:
|
|
2 kWp solar panel system
|
4 kWp solar panel system
|
10 kWp solar panel system
|
|
Inverness
|
1,640 kWh
|
3,280 kWh
|
8,210 kWh
|
|
Difference from Oxford
|
-15%
|
-16%
|
-16%
|
|
Middlesbrough
|
1,820 kWh
|
3,650 kWh
|
9,120 kWh
|
|
Difference from Oxford
|
-6%
|
-6%
|
-6%
|
|
Oxford
|
1,940 kWh
|
3,890 kWh
|
9,720 kWh
|
|
Penzance
|
2,170 kWh
|
4,340 kWh
|
10,800 kWh
|
|
Difference from Oxford
|
+12%
|
+12%
|
+11%
|
There is a significant difference in solar energy generation between different locations in the UK. However if you translate this into return on investment the difference is not so obvious.
Based on the figures above if you installed an identical system in each of the locations you would receive the following in terms of return on investment:
|
Location
|
Energy generated
|
Estimated Return on Investment
|
|
Inverness
|
3,280 kWh
|
10.2 %
|
|
Middlesbrough
|
3,650 kWh
|
11.4 %
|
|
Oxford
|
3,890 kWh
|
12.1 %
|
|
Penzance
|
4,340 kWh
|
13.5 %
|
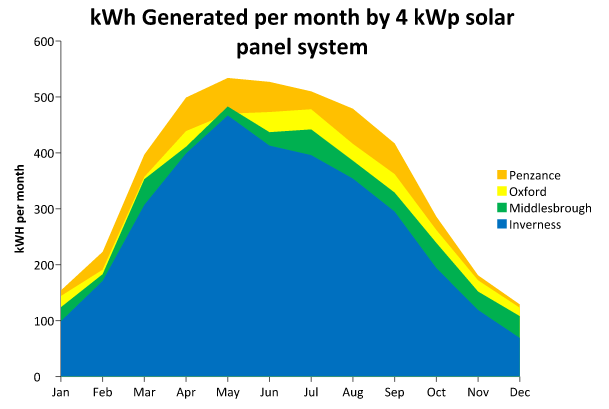
So for identical 4 kWp solar panel systems installed in the very north of the UK to the most southern point there would be a difference of over 1000 kWh of solar energy generated – however this would only result in a difference in return on investment of 3.3%.
So far we have looked at ‘perfect’ systems, all facing south mounted on a 35 degree pitch and with no shading. What happens when you introduce these other variables?
Important Variables in Solar Panel systems
Shading
Shading is a very important issue for solar panel systems and can have a huge impact on the solar panels generation. It needs to be considered seriously as part of the site survey and the design. There are a number of different types of shading split roughly into four types:
-
Micro-shading – This can be cause by a badly designed or positioned system where there are shading issues caused by nearby objects, even things like the solar panel clips themselves. In a well-designed system this type of shading can almost always be avoided.
-
Near-shading – This is caused by shading within 10 meters of the solar panels, for example neighbouring properties, trees, telegraph poles etc. This type of shading is significant but even with a well-placed solar panel array this cannot always be avoided. The shading should always be taken into account when estimating the solar yield so that accurate payback & return on investment calculations can be made.
-
Far-shading – This is any shading that is more than 10 meters away, again including things like buildings and trees. This type of shading is less significant than near-shading but still needs to be taken into account property as part of the design.
-
Horizon shading – This is the least significant type of shading, and in a way is not shading at all but just the fact the sun has not come up! However this can, in some situations, make a big difference as the following shows:
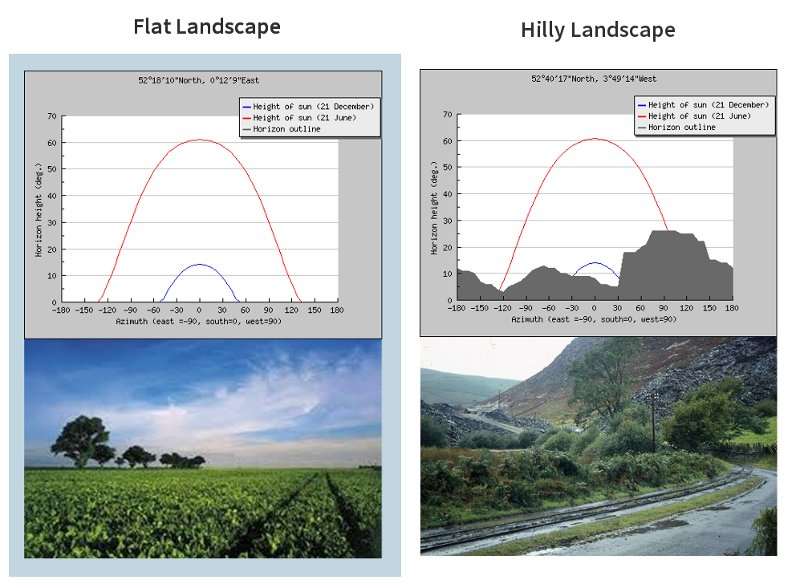
The horizon graphs above were generated using PVGIS.
The blue line is the graphs is the sun path for winter solstice, rising up to about 15 degrees above the horizon and the red line shows the suns path for summer solstice rising to around 60 degrees from horizontal. The grey shaded area is the horizon outline.
You can see that the location in the hilly landscape hardly sees the sun in the middle of winter! Even if there was no other shading issues this would obviously still have a significant effect. Don’t worry though this is a very extreme example chosen specifically to demonstrate a point – most peoples landscape profiles are much closer to the flat landscape.
Take this image below for example – it is the horizon outline for Oxford train station. Bear in mind that this chart is just the horizon caused by local geography, not caused by buildings, trees etc.
The important thing to take away from this is that any shading should be analysed carefully taken account in the design and an annual yield calculated as accurately as possible. If this is done correctly then all the information is available before the installation happens and an informed decision can be made about whether the investment is worth going ahead with.
Remember a shaded solar panel system is always going to generate more power than no solar panels at all!
Orientation & Pitch
As well as shading, orientation and pitch make a big difference to the amount of energy solar panels can generate. Orientation is the degrees from South a solar panel array faces. 0 degrees is facing south, 45 degrees is South-East or South-West and 90 degrees is East or West. Pitch is the degrees the solar panels are from horizontal. 0 degrees is horizontal, 90 degrees is vertical, and most roofs are around 30-35 degrees but can vary significantly. We have installed on flat roofs, pitched roofs and vertical walls!
The best way of demonstrating the effect of pitch and orientation is by using the two charts below. The first shows kWh/kWp in kWh values. The second shows the variation as a percentage difference from the maximum output.
The data for both of these tables is based on information from the 'Guide to the Installation
of Photovoltaic Systems' the for 'Zone 1' which includes London and Oxford. This data can be sourced from the solar pv section of the MCS website.
|
|
|
Orientation - Degrees from south
|
||||||
|
|
|
90
|
60
|
30
|
0
|
30
|
60
|
90
|
|
Pitch -
|
0
|
828
|
828
|
828
|
828
|
828
|
828
|
828
|
|
Degrees
|
30
|
795
|
888
|
953
|
977
|
953
|
888
|
795
|
|
from
|
45
|
751
|
869
|
951
|
980
|
951
|
869
|
751
|
|
Horizontal
|
60
|
684
|
812
|
902
|
933
|
902
|
812
|
684
|
|
|
90
|
488
|
599
|
672
|
695
|
672
|
599
|
488
|
|
|
|
Orientation - Degrees from south
|
||||||
|
|
|
90
|
60
|
30
|
0
|
30
|
60
|
90
|
|
Pitch -
|
0
|
-15%
|
-15%
|
-15%
|
-15%
|
-15%
|
-15%
|
-15%
|
|
Degrees
|
30
|
-19%
|
-9%
|
-2%
|
0%
|
-2%
|
-9%
|
-19%
|
|
from
|
45
|
-23%
|
-11%
|
-3%
|
0%
|
-3%
|
-11%
|
-23%
|
|
Horizontal
|
60
|
-30%
|
-17%
|
-8%
|
-5%
|
-8%
|
-17%
|
-30%
|
|
|
90
|
-50%
|
-39%
|
-31%
|
-29%
|
-31%
|
-39%
|
-50%
|